Trip Analysis
Page Overview
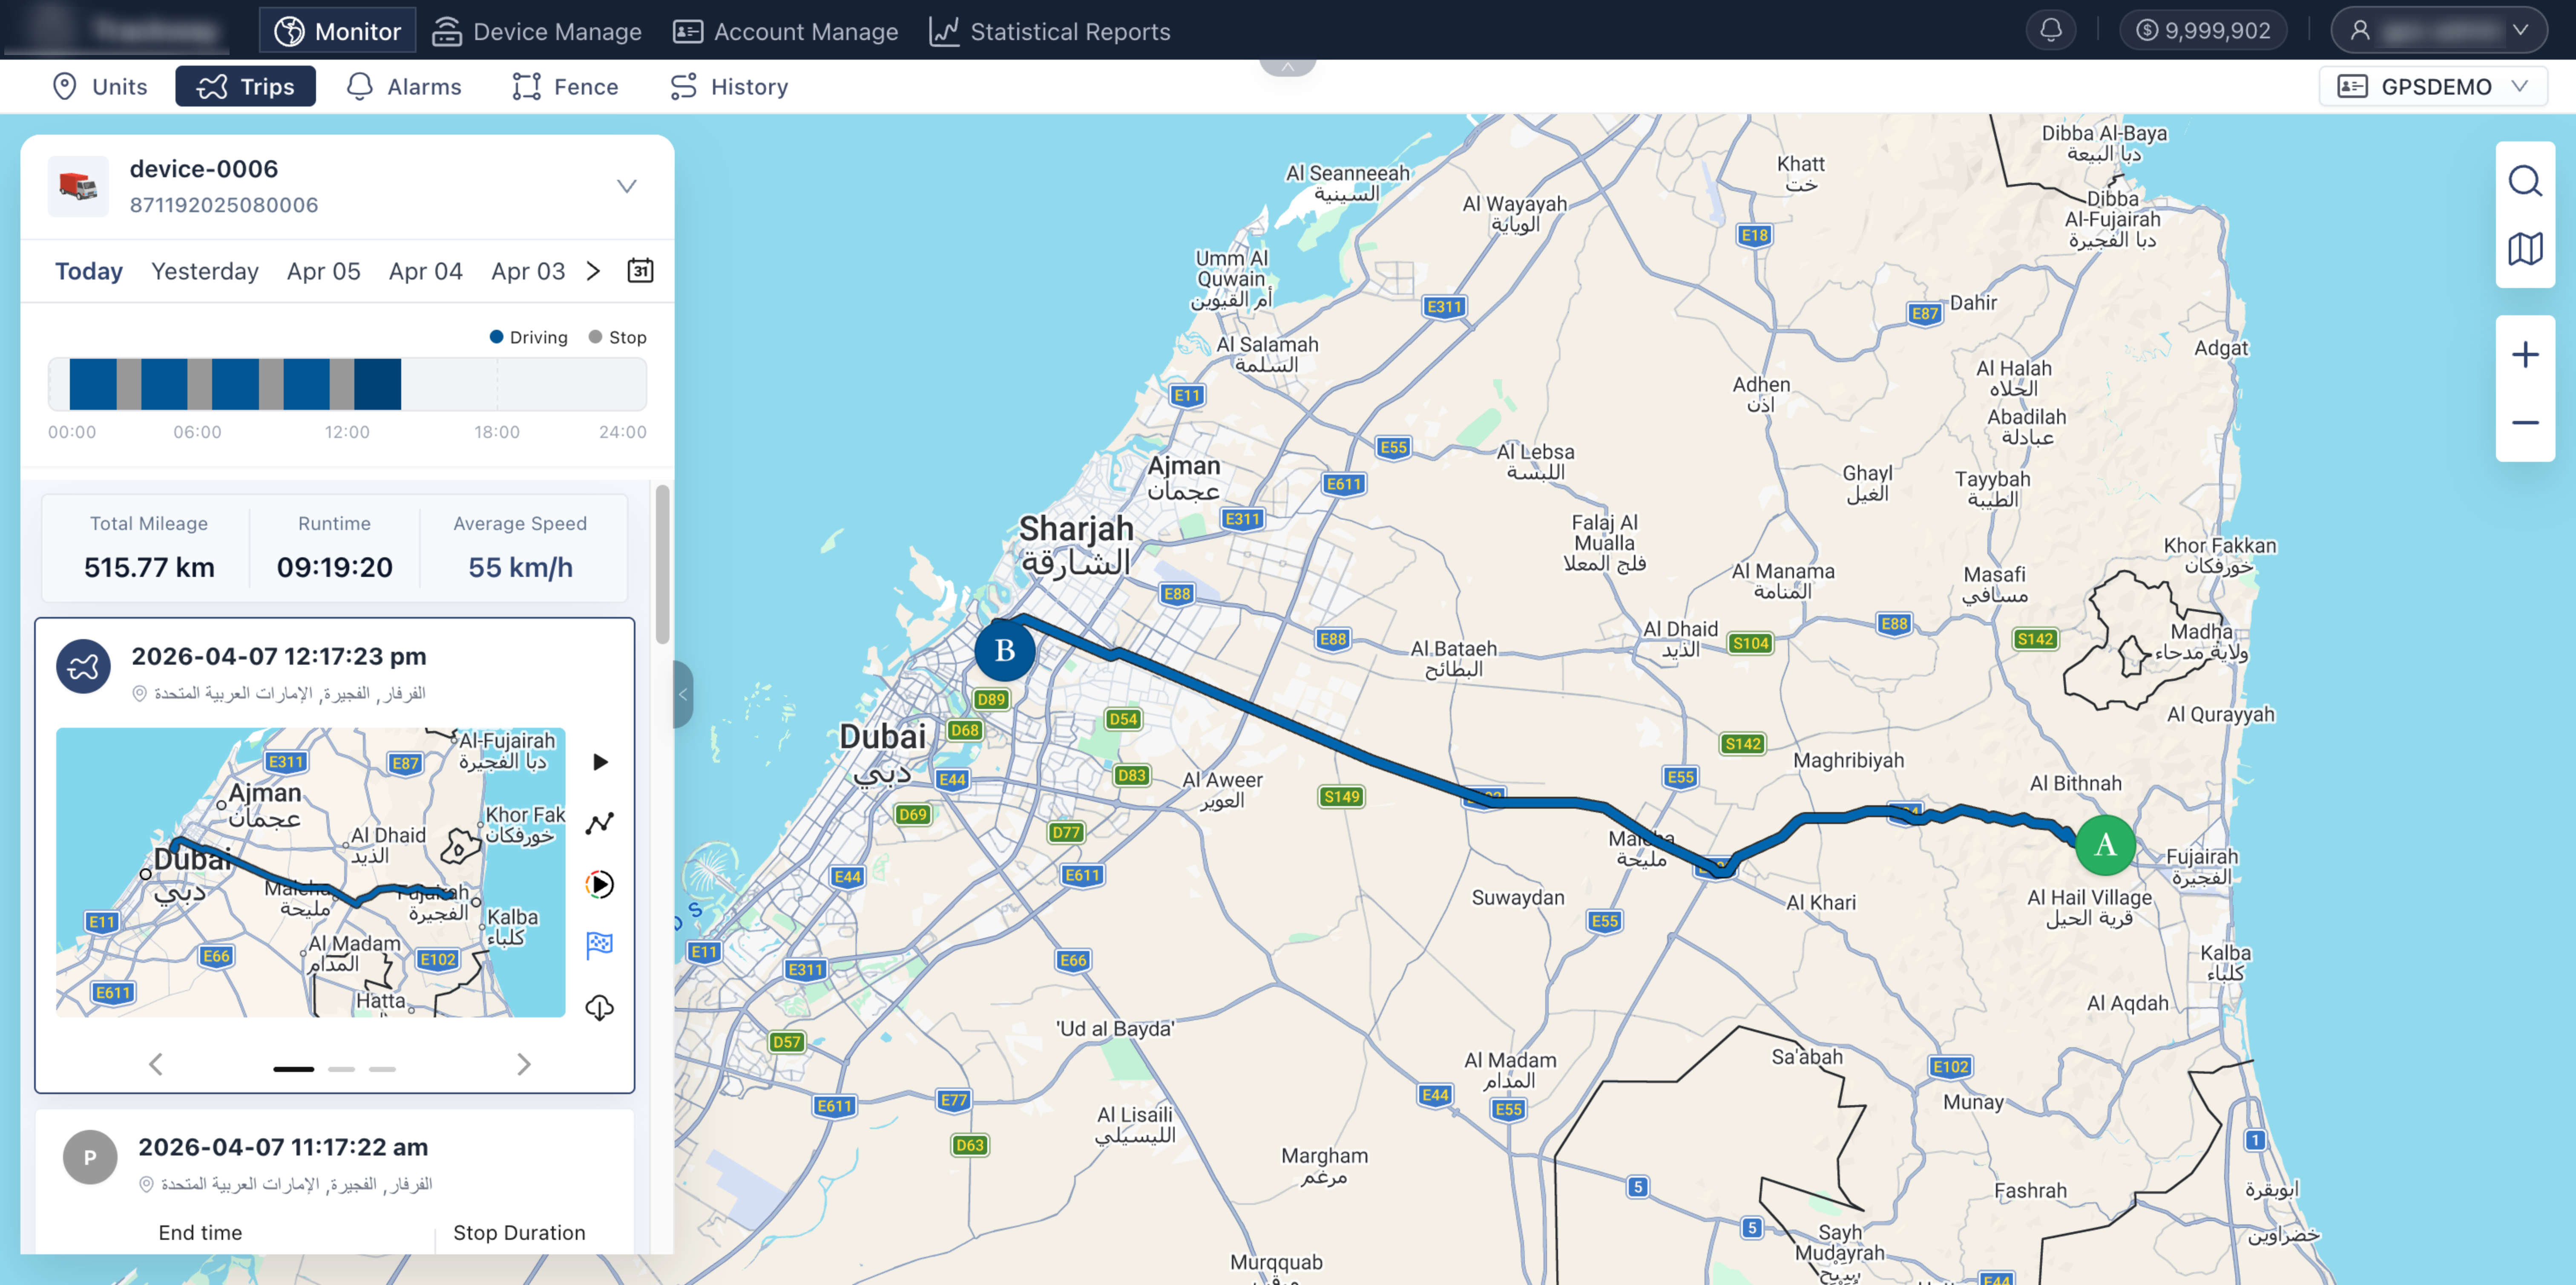
Section titled “Page Overview”The Trip Analysis page is used for precise statistics and review of a single device’s driving process within a selected time range. Through a status timeline, key metric summaries (mileage, duration, average speed), and segmented trip cards, it provides full breakdown of vehicle operations. Combined with deep interaction between map trajectory and speed-segment analysis, it helps fleet managers evaluate efficiency, verify routes, and investigate abnormal stops.
Entry Paths
Section titled “Entry Paths”- Monitoring > Device List > Select a specific device > Click Trip
- Monitoring > Trip > Select target device at the top
Page Features
Section titled “Page Features”Device Selection and Switching
Section titled “Device Selection and Switching”Used to define the target device being analyzed. Steps: At the top of the panel, directly select or search for the target device. If you enter from Device List after selecting a device, the system automatically carries over that device and shows same-day trip data by default.
Date Selection and Filtering
Section titled “Date Selection and Filtering”Flexibly set the analysis time range and quickly retrieve historical data. Steps:
- Quick selection: Use quick date buttons at the top to switch recent ranges in one click.
- Custom date: Click the Calendar icon on the far right to define precise start and end dates.
Status Timeline (Time Bar)
Section titled “Status Timeline (Time Bar)”Displays moving/stationary distribution across the selected date in a horizontal timeline. Feature details: Different colors clearly segment running states on the timeline, allowing users to quickly understand full-day work/rest continuity.
Key Metrics Overview
Section titled “Key Metrics Overview”Summarizes overall operational efficiency indicators for the selected period, including:
- Total Mileage: Cumulative distance traveled in the period.
- Driving Duration: Total time in moving state.
- Average Speed: Overall average speed during trips.
Segmented Trip List (Trip Cards)
Section titled “Segmented Trip List (Trip Cards)”Based on vehicle start/stop states, the system automatically splits one day’s data into multiple independent trip segments displayed as cards from top to bottom. Steps and features:
- Map trajectory linkage: Click any trip card, and the map on the right automatically draws and focuses on that segment’s route.
- Detailed trip analysis (right-side card buttons): Click quick action buttons on the right side of the card for deeper analysis:
- Track replay: Simulate vehicle movement dynamically for that trip.
- Location point details: List each GPS point in that trip (time, coordinates, instantaneous speed, etc.).
- Speed segment distribution: Display different speed ranges on the map trajectory with different colors (for example, low/mid/overspeed), making driving habits and traffic conditions intuitive.
- More expanded data (card bottom): If a card contains more data, slide/switch at the card bottom to view additional fields (for example, max speed, fuel consumption), depending on hardware support.
- Trip segmentation rule: By default, continuous stops longer than a threshold (10 minutes by default) are treated as trip end. Short stops such as traffic lights usually do not split a trip.
- Track offset and mileage error: In tunnels, underground garages, or severe signal interference scenarios, GPS points may be missing or stretched by straight-line jumps, causing small mileage deviations.
Q: Why do some trips end after only a few dozen meters? A: This is usually caused by minor GPS drift while the device stays in place, or very short-distance repositioning inside a park area. The system captures displacement and generates a trip record.
Q: How can I find where the driver drove fastest? A: In the trip list, find the corresponding trip card and click Speed Segment Distribution on the right. The map trajectory shows different colors by speed, so high-speed or overspeed sections are easy to identify.